|
|
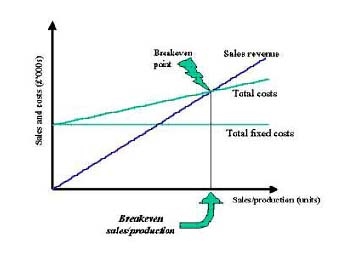

Break-even A business can work out how what volume of sales it needs to achieve to cover its costs. This is known as the break even point. This can be done two ways mathematically and using a breakeven chart. 1. Breakeven chart A break-even chart plots the sales revenue, different costs and helps identify the break even point and margin of safety. Cuddly Teddy Bears produce and sell a range of teddy bears and are now ready to introduce a new bear to the range – Sporty Bear It has worked out the following costs Fixed costs Ł31,000 Variable costs = Ł6.10 per bear They are going to sell at Ł15 per bear Draw a breakeven table calculating figures for sales of 0, 500, 1000,1500,2000,2500,3000 and 3500 bears Draw the break even graph. Draw up a new breakeven table and plot a new break even graph with the following changes Fixed costs = Ł29,700 Variable costs = Ł Ł6.20 Price = Ł14.50 |